V.5 No 1 |
29 |
| On physical processes in showering arcs | |
|
|
V.5 No 1 |
29 |
| On physical processes in showering arcs | |
|
|
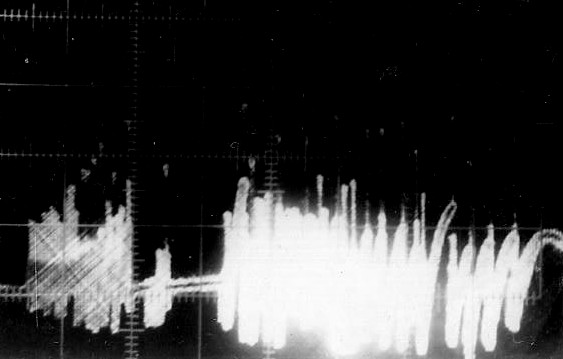
Proceeding from the initial plan, we thought our first task to yield the full pattern of showering arcs. Most typical oscillogram of registered processes in the discharge gap is shown in Fig. 7.
|
|
Fig. 7. Showering arcs consisting of few typical sections divided by the short arcs
|
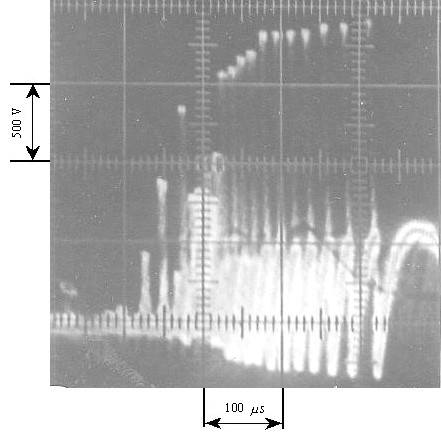
At the same time as we obtained a quite standard oscillogram similar to Mills' oscillograms, with the utmost bright screen we obtained also another oscillogram shown in Fig. 8.
|
|
Fig. 8. Oscillogram of showering arcs obtained with brighter screen of oscillograph
|
Fig. 8 differs from Fig. 7 in of voltage splashes at the ends of sections of capacitance charging that has revealed when brighter screen and considerable vertical scaling of signal. Both oscillograms have common characteristic features described by previous researchers. Despite the oscillograms are much compressed in the axis X, we can clearly see the two-stage pattern of each period of relaxations composing the showering arc. The first stage is slower and confined to 500 V - the limit that, as we saw in the introduction, other researchers thought typical for the breakdown of between-contact gap. The second stage was much faster and surge-like, it was finished with bright luminous points at the tops, which corresponded to (1300 - 1800) V. The rate of voltage growth in this section was so large that in most sections the oscillograph, because of lack speed of sweep, even was unable to register the surge; only bright points at the tops of splashes evidenced a surge. No surprise, with the less signal attenuation, when the tops went out of screen, the researchers could ignore this important detail. To complete the analysis of shown oscillograms, we have to draw attention to the break between the showering arcs seen in Fig. 7. We see here not one but two breaks separated by a short gap of showering arc. This break is typical for processes of partition and we can see it both in the Mills oscillograms (see Fig. 3) and in those by Germer (see Fig. 4). It is important to mark, Mills introduced breaks into each end of monotonous sections supposing that each section is finished by a short arc with vanishing voltage. As we will see further, this is not so in real processes in the contact gap. If with these additions we now return to Fig. 4 and 5, we will see, what namely all previous researchers overlooked, and why the results of their measurement so much differed from each other. As we already said, they omitted the fact that each relaxation is a complex two-stage process; even if someone occasionally saw this second part - voltage surges that finish each charging of parasitic capacitance, - he never paid attention, and the more disregarded in building the model of processes in the short arc. |
Contents: / 23 / 24 / 25 / 26 / 27 / 28 / 29 / 30 / 31 / 32 / 33 / 34 / 35 / 36 / 37 / 38 / 39 / 40 / 41 / 42 / 43 / 44 / 45 /