SELF |
46 |
S.B. Karavashkin and O.N. Karavashkina |
|
|
|
SELF |
46 |
S.B. Karavashkin and O.N. Karavashkina |
|
|
|
|
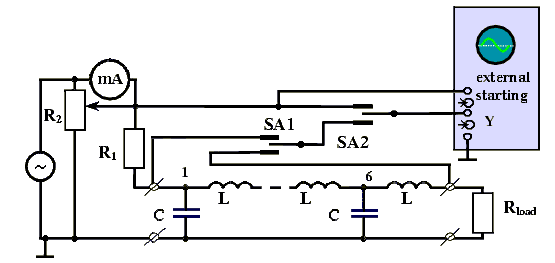
Fig. 9. The schematic diagram of the experimental setup to measure the amplitude-frequency and phase-frequency characteristics of the LC-type ladder filter. The setup parameters: L = 12,6 mH; C = 0,5 mF; R0 = 159,15 Ohm; rL = 10 Ohm; R1 = 20 kOhm; R2 = 33 kOhm; Rload = 0, 51, 102, 158, 358, 558, 758, 958 Ohm.
|
To
check up the obtained calculation regularities, we have carried out the experiment whose
circuit is shown in Fig. 9. Its principal aim was to investigate the amplitude-frequency
and phase-frequency characteristics of the input impedance at the ladder filter pass band
with the constant input current amplitude I (t). The introduced condition of
the input current (not voltage) constancy was caused, on one hand, by the dependence of
solutions (26) on the input current amplitude. And on the other hand, when experimenting,
it is convenient to compare voltages, not currents. Moreover, the phase characteristics
measurement between the voltages excludes a number of essential systematic errors. Basing
on the above arguments, we worked out the experimental scheme. One can see from Fig. 9
that the phase of the filter input impedance was measured as the difference between the
voltage phases at the source output and at the ladder filter input. For it between the
source output and filter input we inserted quite large resistor R1
stabilising the phase of the source output voltage. The second task of this resistor was
to bring the experimental conditions at the filter input nearer to the calculated
conditions, according to which the filter input was loaded (see Fig. 5). The
pattern of input impedance variation with frequency was investigated by the voltage
variation at the filter input being equivalent to the constant input current amplitude.
The experimental data were picked off the screen of oscillograph having a large input
resistance (> 1 MOhm), small input capacitance (~ 40
|
|
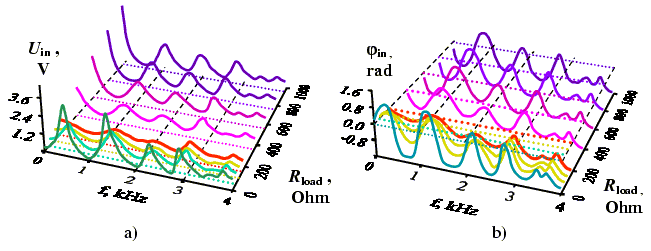
Fig. 10. The experimental amplitude-frequency (a) and phase-frequency (b) characteristics of the input resistance Rin at different active load values Rload and constant input current value I (t) with respect to frequency. The investigated filter parameters: L = 12,6 mH; C = 0,5 mF; R0 = 159,15 Ohm; rL = 10 Ohm; R1 = 20 kOhm; R2 = 33 kOhm; Rload = 0, 51, 102, 158, 358, 558, 758, 958 Ohm.
|
The
results – the amplitude-frequency (a) and phase-frequency (b) characteristics –
are presented in Fig. 10. This first has the form of regularity of the acting voltage
amplitude at the filter input with respect to frequency and input impedance. And the
second has the form of displacement phase in radians, also with respect to frequency and
input impedance. Comparing them with the calculation diagrams in Fig. 6, we see a full accord of the patterns
accurate to the experimental error. The only difference is in the amplitude values of the
resonance peaks when comparing the experimental and calculation data. The calculated
amplitude is some higher. This is caused by the finiteness of resistance R1.
Its value is well more than the filter impedance R0 and is quite large
to ensure a good accord of the phase characteristics, but is not quite sufficient, the
amplitude characteristics to be in full accord with the calculation circuit. Because, as
one can determine by the data in Fig. 6, it is comparable with the maximal value of the
input impedance amplitude in the resonance peaks domain. Basically, the presented method
allows getting over this disparity too. In this order we should complicate a little the
initial mechanical prototype model and consider an elastic line having heterogeneities not
only at its output but also at the input. But since our main aim here is to investigate
just the load impedance influence on the vibration pattern, such refinement is out of
frames of this paper. While within these frames we can surely state that the presented
coincidence of the calculated and experimental results demonstrates quite conclusively
that ladder filters cannot be modelled by a simple assemblage of elementary two-ports in
general case. Their amplitude and phase characteristics have the complex resonance form
well described by the combined method based on the exact analytical solutions for
mechanical elastic lines as the analogue and the dynamical electromechanical analogy DEMA.
With it the ladder filter structure can be much complicated, if necessary, even in frames
of the problem solved here, since one can think under the impedances |
Contents: / 35
/ 36 / 37 / 38 / 39 / 40 / 41 / 42 / 43 / 44 / 45 / 46 / 47 /