| V.2 No 2 | 23 |
Compression waves in a rod |
|
|
|
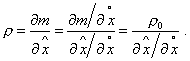
| To describe the complete pattern of process of a line
density time variation, we have to note that the values of density |
|
|
(20) |
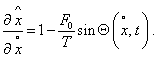
| Provided (17), the expression (15) takes the form | |
|
(21) |
| whence | |
|
(22) |
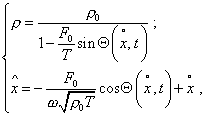
Substituting (22) into (20), yield an expression fully coinciding with (19). It means that in order to
represent the regularity of the line density |
|
|
(23) |
| where the values of non-excited metric
|
|
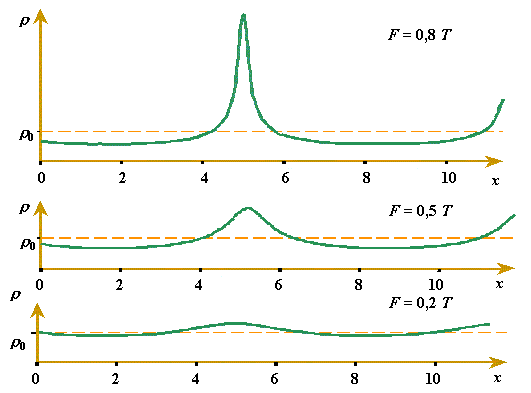
Fig. 1. General form of wave of linear density |
|
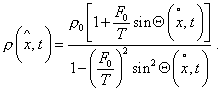
To do so, represent |
|
|
(24) |
| When the external force amplitude is small, we can neglect the relation F0 / T squared. Then yield | |
|
(25) |
Thus we see in frames of linear modelling an additional band of linear solution, in which the time variation of the thin rod density can be presented as a harmonic function. Just this was identified before with linear vibrations. And the reverse statement follows from this. We see that the non-linear vibrations arise in frames of linear modelling too, its applicability appears wider than in was established before on the basis of harmonic solutions. This enables to refine essentially the lower threshold of non-linear modelling that is based on results obtained by way of linear modelling. Anticipating, we can say that in the light of obtained solutions, in transition of the rod material to the state of fluidity, the value of stiffness T will diminish in the stressed region, and according to (19) the limiting value of F0 will diminish too. Thus, for real materials we can expect the limiting load diminishing in the compression region on the account of fluidity and due to the growing gradient of density in the compression region that we have revealed in this paper. |
|