V.5 No 1 |
31 |
| On physical processes in showering arcs | |
|
|
V.5 No 1 |
31 |
| On physical processes in showering arcs | |
|
|
Given the obtained results, general pattern of processes in showering arc takes the shape shown in Fig. 11.
|
|
Fig. 11. Improved appearance of showering arcs produced at the contacts opening an inductive load: 1 are positive voltage surges, 2 is the monotonous section of charging of parasitic capacitance of contact gap, 3 are negative voltage surges, 4 is the final aperiodic regime of voltage change at the contacts, 5 is the short arc
|
With the improved physics of voltage relaxations, the general structure of model has to change; this new model has to be strongly different from Mills' diagram (see Fig. 2 and 3 ) and to have a shape shown in Fig. 12.
|
|
Fig. 12. The improved model of showering arcs that accounts bipolar surges at the contacts at the ends of monotonous sections
|
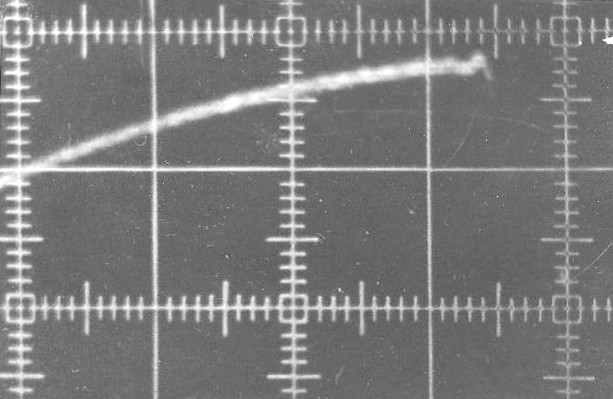
In this plot, besides the above considered high-voltage oscillation sections, we see one more distinction from Mills' model. The monotonous sections of process are shown not as direct lines but as exponents; this is well seen in all oscillograms presented above, in that number we see it in Fig. 10, despite small amplitude of monotonous process. This important point of understanding of processes in showering arcs became the next stage of our study. To make more convincing just the exponential pattern of voltage change in the monotonous section, we yielded the developed oscillograms of monotonous sections. One of typical oscillograms is shown in Fig. 13.
|
|
Fig. 13. Typical oscillogram of monotonous section of the showering arc |
| In the oscillogram showing the end of monotonous section before high-voltage surge, we can clearly see the exponential pattern of voltage growth, which unambiguously corroborates that our model in Fig. 11 and 12 was correct. |
Contents: / 23 / 24 / 25 / 26 / 27 / 28 / 29 / 30 / 31 / 32 / 33 / 34 / 35 / 36 / 37 / 38 / 39 / 40 / 41 / 42 / 43 / 44 / 45 /