SELF |
36 |
|
|
|
|
SELF |
36 |
|
|
|
|
4. Theoretical and experimental substantiation of multiple production and breakage of metallic bridges in an opening contact gap Consider, which approximately values of resistance can have metallic bridges. To determine, we will use Mills' oscillograms (see Fig. 1), as in them, as opposite to ours, there is seen an important dependence of the process on the speed of contacts motion. We will think maximal lengths of bridges corresponding to the duration of unstable discharges. According to the oscillograms, at speed of contact partition equal to 16,8; 42,1 and 66,7 sm/s, duration of unstable discharges is equal to 240, 150 and 120 mcs. With such parameters the maximal lengths of bridges are equal to 40,32; 63,15 and 80,04 mcm.We can estimate the bridge diameter after the table [31] of ratios of diameters of first bridges dm to the switched currents Ik. For copper, silver and gold, these ratios are similar, so we can take |
| (13) |
Mills yielded his oscillograms at the current 0,07 A; in this case the bridge diameter is 1,4 mcm. Formula (13) has been developed for first bridges. Diameters of the next bridges probably will be well less, as they rather are not pulled loose from the melt, as first bridges, but are produced otherwise. We have not found in literature the specific resistance of liquid metals, so for approximate calculation, let us use the formula [32] to determine the specific resistance of silver with respect to temperature: |
| (14) |
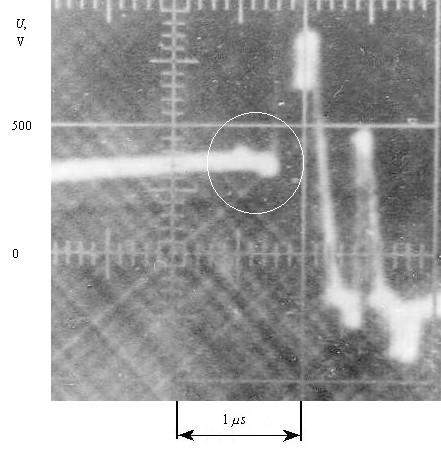
where On the basis of yielded data, we can estimate the bridge resistance, thinking them cylindrical. For the yielded above lengths 30,32; 63,15 and 80,04 mcm, bridge resistances are correspondingly 11, 17 and 22 Ohm, and seemingly we can take these values as their lower limits. If we compare them with (10), we will see, with the values of inductance and parasitic capacitance which we used in our experiments, as well as with the values of parameters of Mills' circuit, show the yielded values of resistance corresponding to the monotonous process of charging of parasitic capacitance. Thus, our estimations additionally corroborate the possibility of bridge producing as the cause for transition from oscillation to monotonous process. To check experimentally the supposition of metallic bridges during the monotonous charging of parasitic capacitances, we studied oscillographically the moments of their supposed formation and destruction. This study had an aim to corroborate the following premises. If the transition from monotonous process of voltage change to that oscillation and vice versa was caused by formation and breakage of metallic bridges, these breakages occur in the regions where the voltage transits from the exponential sections to those surge-like, and bridges are formed in transition from the surge-like sections to those exponential. Hence, instants of bridge formation and breakage are concentrated near the voltage surges. As the oscillation process in the circuit cannot abruptly stop with the change of parasitic capacitance shunt, the breakage and formation of bridges have to bring definite changes in contact gap resistance, which will be certainly seen. These nuances naturally were unseen in general oscillograms of unstable discharges which we presented above, as in them the regions of voltage surges are so much compressed in time and in amplitude that it is impossible to consider them in details. Our experiments showed the duration of voltage surges less than 1 mcs, so we have to study them at the speed of oscillograph sweep no less than 1- 2 mcs/sm. With such sweep, given the occasional in time pattern of bridges production and decay, it appeared possible to register the regions of voltage surges only after applying the regulated time retardation and with long-duration series of experiments. Before we present the experimental results, consider in more details the conditions which can destroy the metallic bridge. Dependently on the value of switched current and rate of contacts partition, two factors will affect the bridge: joule heat released because of going current and mechanical elongation and thinning because of contact divergence. The first factor dominates at large switching currents, when the bridge bursts at the point of boiling. At its place the cloud of metallic vapour forms. The cloud is developed [33] in a wave-like way, i.e. the cloud density some time varies periodically, until dissipates. During this time the cloud resistance will also oscillate and gradually grow up to infinity. At small switching currents, a "cold" break of bridge can occur, as joule heat is insufficient to burst, mostly mechanical force exerts on the bridge break. At the first instant of bridge break, two near-positioned needle-shaped surfaces are formed. Each of them is affected by the force of electrostatic attraction that brings them closer, and force of surface strain that brings them farther. Under affection of both forces, the surfaces now join, now separate. This causes an unstable state of bridge and defines the wave-type variation of its resistance. Consequently, irrespectively of the way of bridge breakage, at the opening contacts there have to arise the voltage oscillations corresponding to the resistance variations before breakage. And we really have registered these oscillations. Typical oscillogram is shown in Fig. 20.
|
|
Fig. 20. Oscillogram registered the oscillation processes at the end of monotonous section of showering arc
|
As we see, this oscillation process is insignificant in value and duration, none the less it is typical and observable in all oscillograms made with the high-speed sweep. In that number they are seen in Fig. 14 b. |
Contents: / 23 / 24 / 25 / 26 / 27 / 28 / 29 / 30 / 31 / 32 / 33 / 34 / 35 / 36 / 37 / 38 / 39 / 40 / 41 / 42 / 43 / 44 / 45 /